Infographic
Why cars fail their first MOT: DVSA data for 2025 to 2026
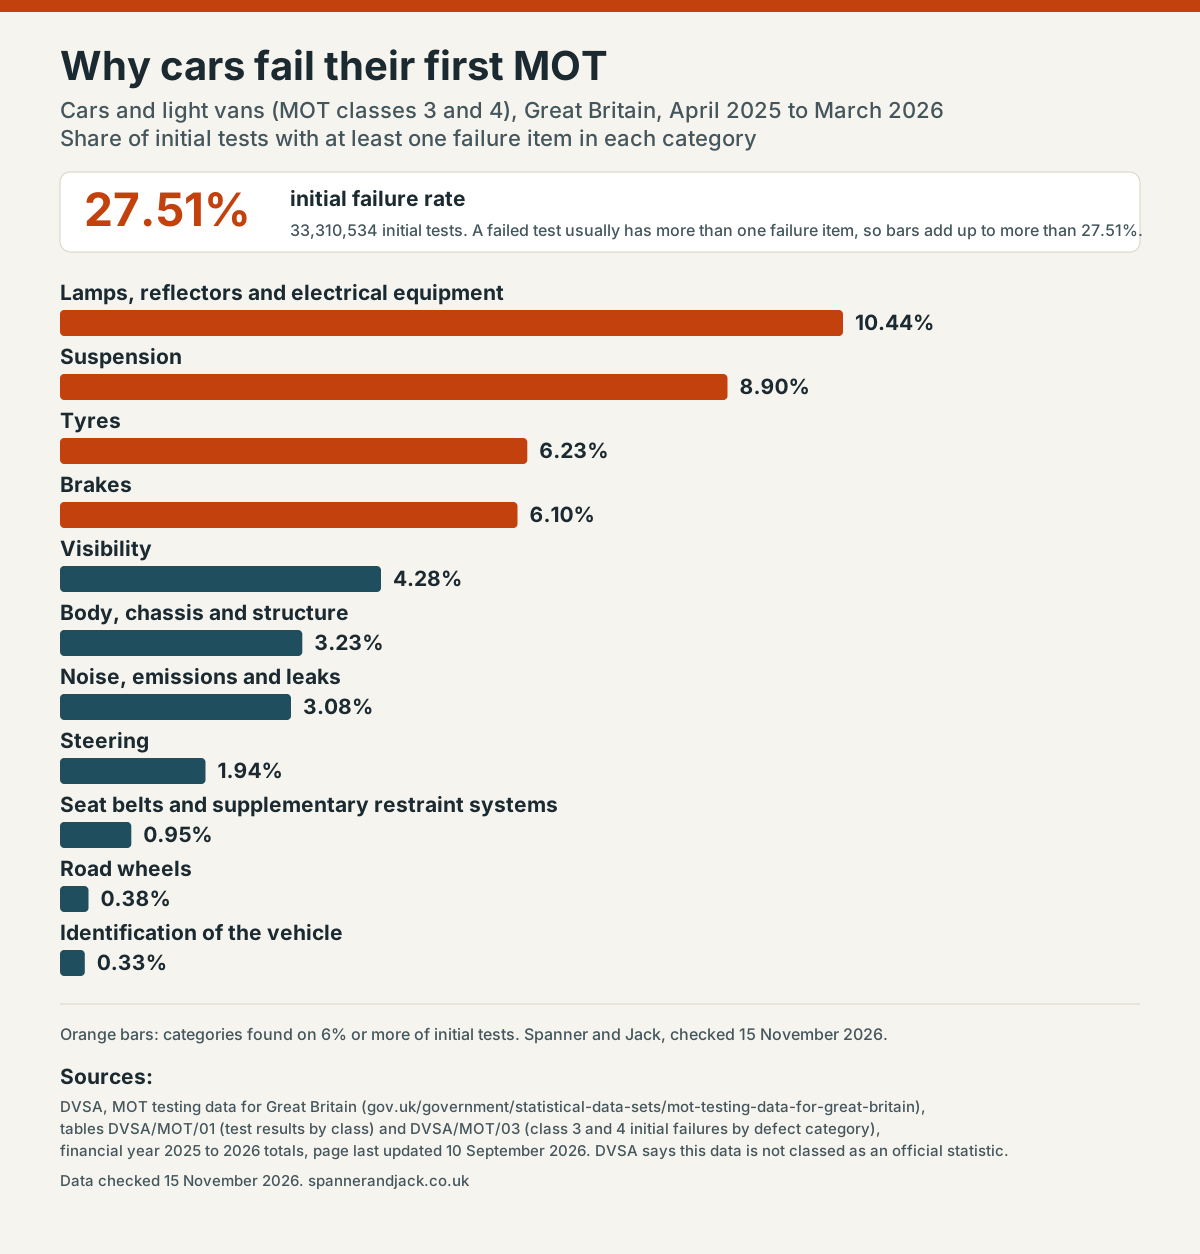
Which MOT categories catch cars and light vans most often, from DVSA data for the financial year April 2025 to March 2026.
The figures as a table
MOT classes 3 and 4 (cars, vans and passenger vehicles with up to 12 seats), Great Britain, financial year 2025 to 2026 totals. Each figure is the share of initial tests with at least one failure item in that category. One failed test usually has several failure items, so the rows add up to more than the overall failure rate.
| Defect category | Share of initial tests |
|---|---|
| Lamps, reflectors and electrical equipment | 10.44% |
| Suspension | 8.90% |
| Tyres | 6.23% |
| Brakes | 6.10% |
| Visibility | 4.28% |
| Body, chassis and structure | 3.23% |
| Noise, emissions and leaks | 3.08% |
| Steering | 1.94% |
| Seat belts and supplementary restraint systems | 0.95% |
| Road wheels | 0.38% |
| Identification of the vehicle | 0.33% |
- Initial tests on classes 3 and 4: 33,310,534.
- Initial failure rate: 27.51%. Final failure rate (excluding cars that passed after minor fixes at the test): 22.30%.
The DVSA notes this data set is not classed as an official statistic, so it is not assessed by the UK Statistics Authority. For what each category covers and what you can check yourself before the test, read the most common MOT failures and the MOT checklist.
Sources
- MOT testing data for Great Britain, Driver and Vehicle Standards Agency, tables DVSA/MOT/01 and DVSA/MOT/03, page last updated 10 September 2026, accessed 15 November 2026.
Embed this infographic
You are welcome to use this graphic on your own site. Please keep the credit link. Copy the code below:
<a href="https://spannerandjack.co.uk/infographics/mot-failures-2025-26/"><img src="https://spannerandjack.co.uk/assets/images/mot-failures-2025-26-infographic.svg" alt="Bar chart: share of initial MOT tests on cars and light vans with a failure item in each category, April 2025 to March 2026. Lamps and electrical 10.44%, suspension 8.90%, tyres 6.23%, brakes 6.10%, visibility 4.28%; overall initial failure rate 27.51%." width="1200" height="1254"></a><p>Infographic by <a href="https://spannerandjack.co.uk/">Spanner and Jack</a></p>