Guides · MOT
Most common MOT failures: DVSA data for 2025 to 2026
The most common reasons cars fail the MOT in Great Britain, from DVSA data for April 2025 to March 2026, plus simple checks you can do before your test.
More than a quarter of cars and light vans fail their MOT first time. Plenty of those failures come down to things you could spot in ten minutes on the driveway. Using the latest Driver and Vehicle Standards Agency (DVSA) data, here's what fails most often, what each category covers, and the simple checks to do before the test.
The headline figures
The figures come from DVSA's MOT testing data for Great Britain, for class 3 and 4 vehicles (cars and light vans up to 3,000 kg) in the financial year April 2025 to March 2026. The page was last updated on 10 September 2026.
- 33,310,534 initial MOT tests were carried out on class 3 and 4 vehicles (DVSA/MOT/01).
- The initial fail rate was 27.51%: the rate for vehicles as they were brought in.
- The final fail rate was 22.30%, which excludes vehicles that passed after minor faults were fixed at the test centre during the test. That covered 1,733,209 tests.
- A failed test had 2.39 defects on average (DVSA/MOT/03).
Worth knowing
DVSA says this data set "is not classed as an 'official statistic'", meaning it is not scrutinised by the UK Statistics Authority. It covers initial tests only: not retests, abandoned or aborted tests. A single failed test often has several failure items, so the category percentages below add up to more than the overall fail rate.
Failure categories, ranked
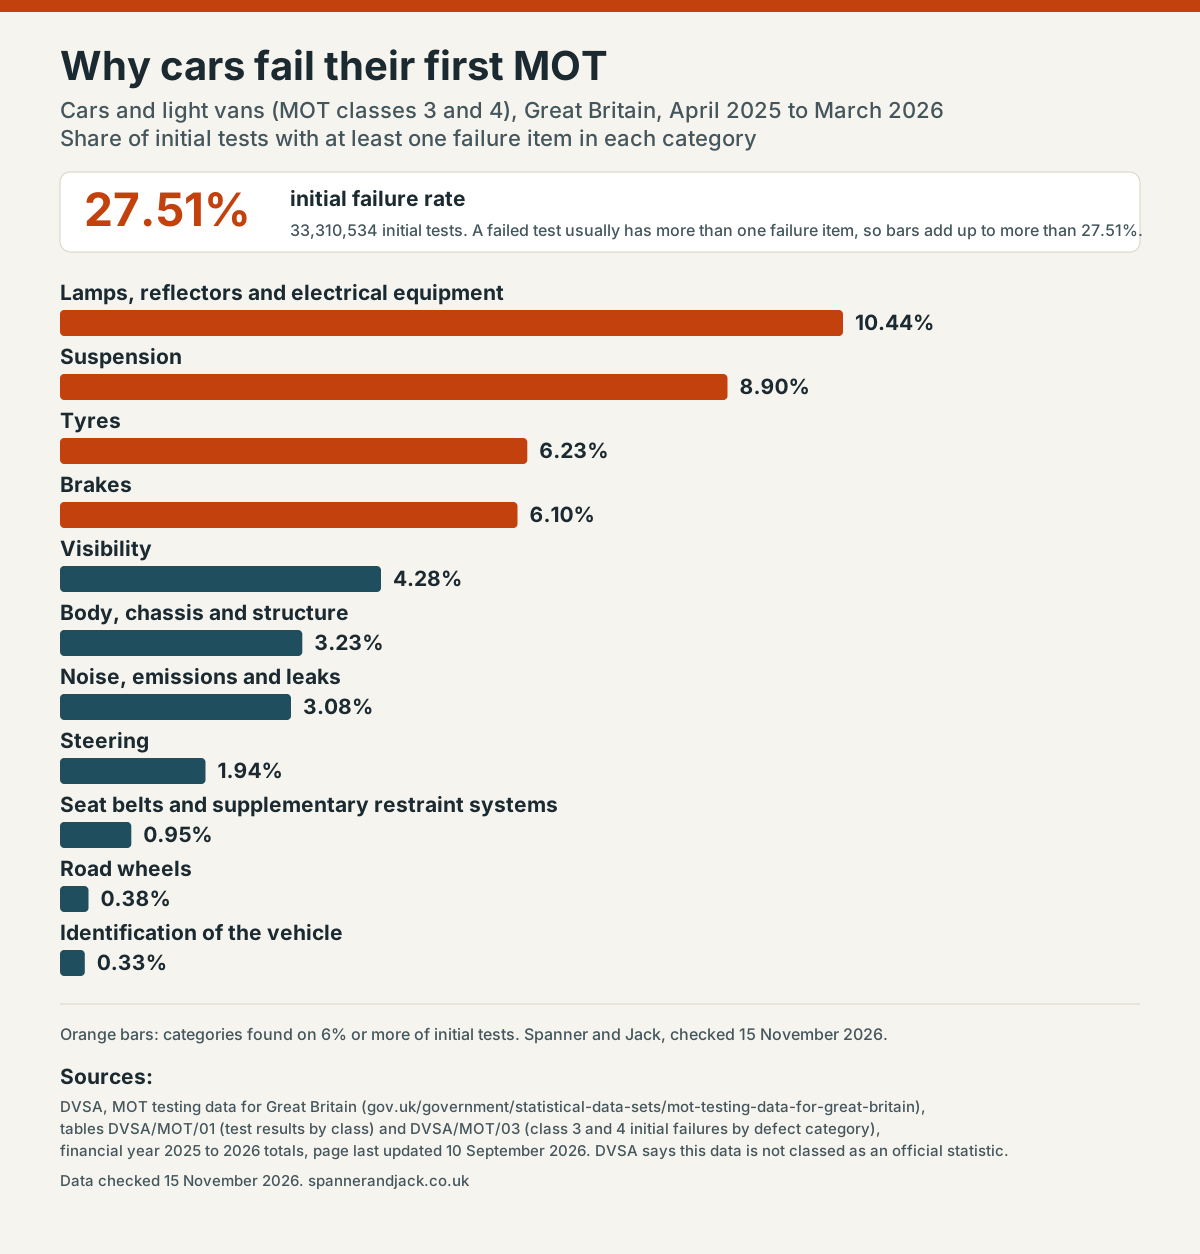
This table shows the percentage of initial tests that had at least one failure item in each category, for April 2025 to March 2026 (DVSA/MOT/03).
| Rank | Defect category | % of initial tests with a failure item |
|---|---|---|
| 1 | Lamps, reflectors and electrical equipment | 10.44% |
| 2 | Suspension | 8.90% |
| 3 | Tyres | 6.23% |
| 4 | Brakes | 6.10% |
| 5 | Visibility | 4.28% |
| 6 | Body, chassis, structure | 3.23% |
| 7 | Noise, emissions and leaks | 3.08% |
| 8 | Steering | 1.94% |
| 9 | Seat belts and supplementary restraint systems | 0.95% |
| 10 | Road wheels | 0.38% |
| 11 | Identification of the vehicle | 0.33% |
What each category means, and what you can check
1. Lamps, reflectors and electrical equipment (10.44%)
The biggest single category. Section 4 of the MOT inspection manual covers headlamps (including aim), position lamps, brake lights, indicators and hazard lights, fog lamps, reversing lamps, rear number plate lamps, reflectors, the dashboard "tell-tale" lights for lighting, wiring and the battery.
Check yourself: walk round the car with every light switched on in turn. Ask someone to press the brake pedal and select reverse while you look, or reverse up to a garage door or window and watch the reflection. Don't forget the number plate lamp and the high-level brake light. A blown bulb is often a cheap fix, so do it before the test.
2. Suspension (8.90%)
Springs, shock absorbers, suspension arms and joints, covered in section 5 of the manual. These are mostly hidden, so this is a job for a garage. Signs to look for: knocks or clunks over bumps, the car sitting lower on one corner, or bouncing on after a bump.
3. Tyres (6.23%)
Tyres were the category with the most dangerous defects. In the DVSA data, tyres accounted for 60.60% of all dangerous defects recorded at initial tests in 2025 to 2026. The legal minimum tread for cars is 1.6 mm across the central three-quarters of the tread and around the entire circumference, according to both the Highway Code annex 6 and the MOT manual section 5. The test also looks at condition, size and type. Spare tyres are not inspected (GOV.UK).
Check yourself: use a tread depth gauge in several places on each tyre, look for cuts, bulges and exposed cord, and set pressures to the handbook figure when the tyres are cold. Our tyre tread and pressures guide shows how. On cars first used from 1 January 2012, the tyre pressure warning light is also checked.
4. Brakes (6.10%)
Brakes were the second-largest source of dangerous defects, at 28.80% of the total. The MOT checks condition, performance, ABS, electronic stability control and the brake warning lights (GOV.UK).
Check yourself: make sure no brake or ABS warning lights stay on, check the brake fluid level against the marks on the reservoir, and note any grinding, pulling to one side or a soft pedal. Brake repairs themselves are a job for a qualified mechanic. See our dashboard warning lights guide.
5. Visibility (4.28%)
The driver's view of the road. Section 3 of the manual (visibility) lists damage more than 10 mm across in "zone A" (a 290 mm wide strip of the swept area centred on the steering wheel), or more than 40 mm elsewhere in the swept area, as a defect. It also covers mirrors, wipers and washers. A wiper blade obviously not clearing the screen, or washers not giving enough fluid, are major defects.
Check yourself: fill the screenwash, test the washers, replace split or smearing wiper blades, check the mirrors are secure and undamaged, and remove anything blocking your view through the windscreen.
6. Body, chassis, structure (3.23%)
This includes excessive corrosion or damage in specific areas, and sharp edges. Appendix A of the MOT manual defines "prescribed areas": load-bearing parts that brakes, steering, suspension and other testable items such as seat belts are mounted to, plus supporting structure within 30 cm of those mountings. For a closer look at how corrosion in those areas is judged, see this guide to rust in MOT prescribed areas. Structural rust repair needs a professional.
7. Noise, emissions and leaks (3.08%)
Exhaust noise, emissions and fluid leaks, plus the engine management light (section 8). An engine light that is on, or indicating a malfunction, is a defect. Check yourself: look for drips under the car and listen for blowing or rattling from the exhaust. For diesels, GOV.UK advises taking the car in with a fully warmed-up engine and keeping the cambelt changed at the recommended interval, as testers can refuse the smoke test if they think it may damage the engine.
8 to 11. Steering, seat belts, wheels and identification
- Steering (1.94%): includes the power steering warning light. Heavy or vague steering needs a garage.
- Seat belts and SRS (0.95%): pull each belt out fully and check it for fraying, check it latches and retracts, and make sure the airbag light goes out after starting.
- Road wheels (0.38%): check for missing wheel nuts and obvious damage.
- Identification of the vehicle (0.33%): number plates must be legible, correctly formed and spaced, and not altered, and the VIN must be displayed. Clean your plates and replace cracked ones.
A ten-minute pre-MOT routine
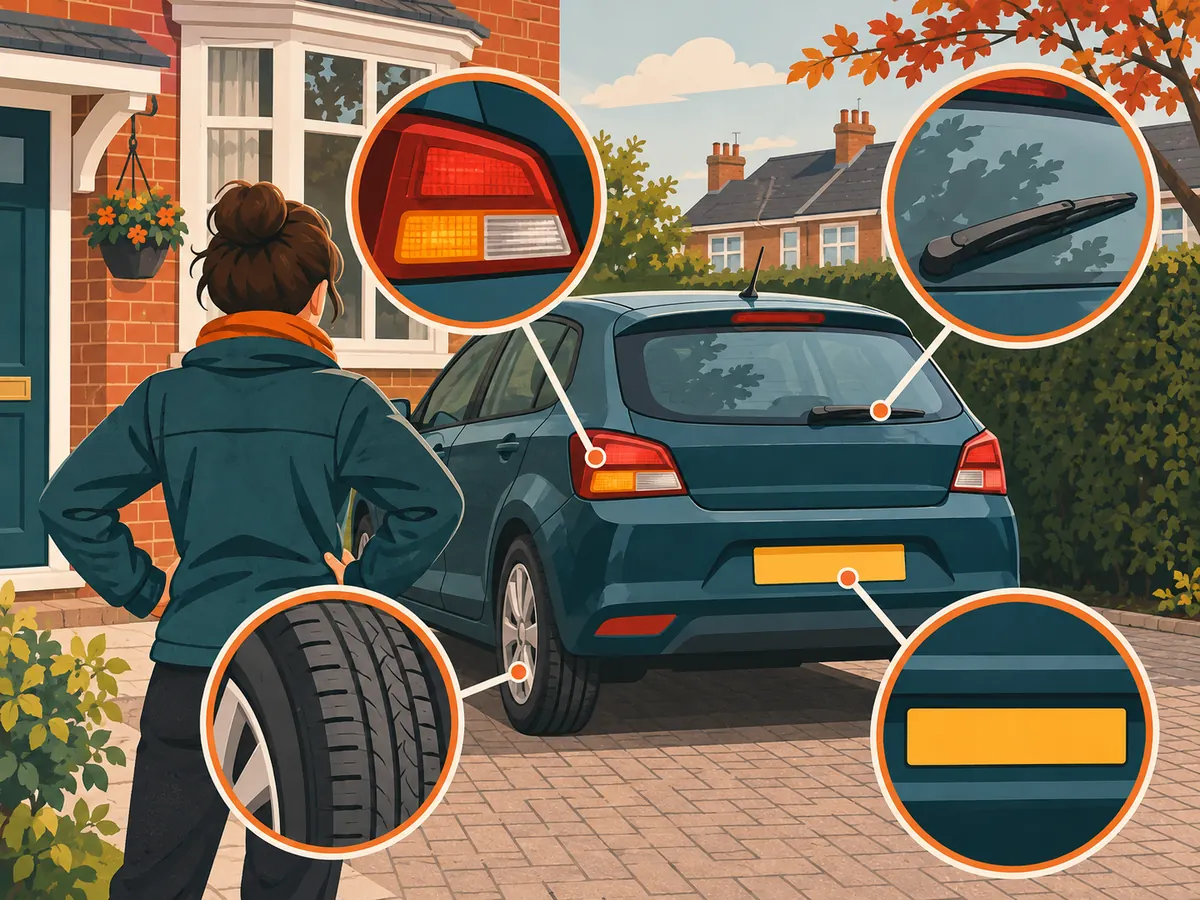
- Every exterior light, including brake lights, indicators, hazards, fog and number plate lamps.
- Tyre tread (1.6 mm minimum), condition and pressures.
- Wiper blades, washers and screenwash.
- Windscreen chips and cracks in the driver's line of sight.
- Horn.
- Seat belts.
- Dashboard warning lights after starting.
- Number plates clean and intact.
- Fuel cap opens, closes and seals; keep the key with the car.
- Clear clutter from the boot and cabin. The MOT manual introduction lets testers refuse a car that is too dirty to examine properly.
Our full MOT checklist explains each item. If the car does fail, our guide to MOT defects, advisories and history covers what happens next.
FAQ
What is the most common reason for an MOT failure?
In DVSA data for April 2025 to March 2026, lamps, reflectors and electrical equipment was the most common category, with 10.44% of initial car and light van tests having at least one failure item there.
What percentage of cars fail the MOT?
The initial fail rate for class 3 and 4 vehicles in 2025 to 2026 was 27.51%. After minor faults fixed during the test, the final fail rate was 22.30%.
Is the DVSA MOT data official statistics?
No. DVSA says the MOT testing data set is not classed as an official statistic, so it is not subject to UK Statistics Authority assessment.
Sources
- MOT testing data for Great Britain — GOV.UK (DVSA), accessed 15 November 2026.
- DVSA/MOT/03: MOT class 3 and 4 vehicles, initial failures by defect category (CSV) — DVSA, accessed 15 November 2026.
- DVSA/MOT/01: MOT test results by class of vehicle (CSV) — DVSA, accessed 15 November 2026.
- MOT inspection manual: 3. Visibility — GOV.UK (DVSA), accessed 15 November 2026.
- MOT inspection manual: 4. Lamps, reflectors and electrical equipment — GOV.UK (DVSA), accessed 15 November 2026.
- MOT inspection manual: 5. Axles, wheels, tyres and suspension — GOV.UK (DVSA), accessed 15 November 2026.
- MOT inspection manual: 8. Nuisance — GOV.UK (DVSA), accessed 15 November 2026.
- MOT inspection manual: Appendix A, structural integrity and corrosion — GOV.UK (DVSA), accessed 15 November 2026.
- MOT inspection manual: introduction — GOV.UK (DVSA), accessed 15 November 2026.
- Car parts checked at an MOT — GOV.UK (DVSA), accessed 15 November 2026.
- The Highway Code, annex 6: vehicle maintenance, safety and security — GOV.UK, accessed 15 November 2026.
- MOT corrosion failures: what testers check in prescribed areas — Rust Prevention Garage, accessed 15 November 2026.